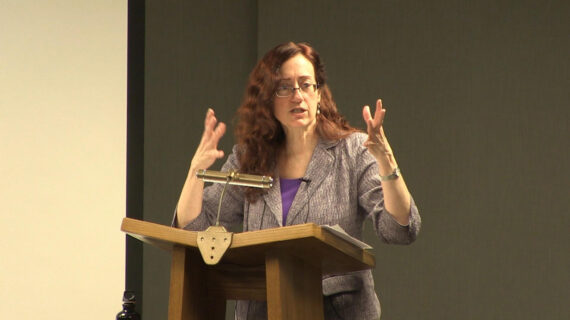
I’d like to introduce to you Rick Anthes who is a former student here going way back into 1962 when he was an undergraduate student from out of state, I believe. Is that right? You came from Virginia. And then he went on to a masters degree and a PhD. His talk today is gonna be more of a general topic just about philosophy and modeling and what we can do with weather prediction overall, called “Demons and Butterflies,” so here’s Rick. (applause)
– So without further ado, and you’ll see why in a minute, I’m going to get started, and with a prologue. Actually more than half of the slides are not even directly related to my talk. This is kind of interesting. The prologue is very long, and the title of the prologue is “Sandy, Harvey, Irma and Maria: A Photographic Essay.” And I hope this is relevant from a societal point of view about what the real talk is going to be about. So hurricanes, you’ve seen many pictures. They’re absolutely beautiful from space. They’re just majestic, artistic almost. They’re just amazing to see. And so many people, this is one of the reasons I got interested in hurricanes because from a distance they’re just wonderful. But when you actually experience one, it’s anything but beautiful. Hell on Earth. And I’ll start out with Sandy. This is a split image of New York City on a typical night at top, and the night after Sandy hit in the lower half where almost all the city is without power. So now I won’t say anything for the next hundred slides or so. (somber music) And then, I’m trying to inject a tiny bit of humor at the end of this.
There’s Hurricane Nate where the chief damage was blowing a bunch of pumpkins out of a field. But anyway these are picture stories that I don’t think I get from the news. You hear of 27 deaths and a billion dollars of damage and this kinda thing and it doesn’t until you see the variety of people who are affected by these things and the amount of time it takes to rebuild their lives. So what about Hurricane Sandy? And I was inspired to do this talk right after Sandy which was 2012. It formed in the western Caribbean late in the year, October 22nd, almost this time of year. It made landfall in New Jersey on October 29th, very late. The largest Atlantic hurricane on record. And these are statistics. They just don’t tell the story you saw.
53 people killed, $32 billion in damage which is about 1/3 of the government sequester at that point. So how good were the forecasts of Hurricane Sandy? They were superb, they were excellent, they were unbelievable, and it wasn’t by chance. How many more lives would have been lost without these excellent forecasts? You saw the damage that was done, and it’s a remarkable thing that only 53 people were killed. Probably thousands would have been killed if that storm had come in unannounced. And imagine if people weren’t prepared for it what the loss of life would be. Never before had a hurricane approached the East Coast from the east in late October. Came in from the east. Never before. Here is a set of tracks, the historical tracks, of hurricanes that came within 200 nautical miles of New York City from 1851 to 2011, the entire record up until 2012.
You see every one of those tracks, by the time the storm hit past the Virginia capes was heading off to the north and northeast. The Hurricane Sandy came up the coast and, if you were a forecaster who had no satellite observations or models and you saw that track, everybody would have forecast continuing moving out to sea. Instead it did something that no storm had ever done before. It turned to the left and came in and made landfall from the east. Never ever before happening, and yet it was well predicted. How can that be? Here’s a forecast from the European Centre for Medium-Range Weather Forecasting 9 1/2 days before landfall. And on the left you can see that their outlook nearly 10 days before landfall had this grayish area off the Atlantic Coast where already they were forecasting, some of their models were forecasting major events, significant probability of the severe windstorm affecting the Northeastern United States. Then by the time three days later, 6 1/2 days before landfall, the various models were forecasting those tracks that you see in the middle panel. And already almost a week before landfall, the models were forecasting this left turn, which again had never happened before.
So this is not an empirical model based on past data. It is a model based on laws of physics and mathematics and observations. And then the observed track is shown on the right panel. So extremely well forecast. People had many days of warnings and were well prepared. A lot of people say, “Well, we got through that disaster. “It’ll never happen again in my lifetime and it can’t happen to me again.” Well, this is this year. Jump forward nine years to 2017, or five years I guess it is. Through September there have been 15 separate $1 billion weather and climate disasters just through September.
So we’re on a track for a record year. And you see they’re all over the country. There’s hurricanes, there’s tornado outbreaks, there’s fires, all kinds of things. And it’s just no question this is not just anecdotal. There’s no question that the frequency of severe weather and climate events is getting higher. And why is that? Well, this is not a talk on global warming, but, “It is global warming, stupid.” And that’s all I’ll say about that. So the lecture is “Demons and Butterflies,” but I’m trying to set the context for something that’s important. What is this? It’s a fortuneteller. It’s a wizard.
Somebody that tells the future. Amazing people would believe this guy before they believe science. But foretelling the future has always been a fascination of humanity, and prophets over the ages have been worshiped and vilified. It’s said that– You’ve already heard this joke I’m sure. A meteorologist says weather forecasters are the second oldest profession in the world. People want to know what’s gonna happen in the future. So foretelling the future has always been a fascination whether it’s forecasting the stock market or forecasting a football game results or whatever it is, people love to talk about forecasting the future. And you see it in these common expressions. I should have known.
I should have seen it coming. In retrospect, it was obvious. 20-20 hindsight. The signs were there for all to see. Sixth sense. Premonition. And in today already walks tomorrow. The present is big with the future. Good detectives such as Sherlock Holmes and Hercule Poirot deduce what has happened and sometimes what will happen from a few observations.
Foretelling the future can be based on past behavior, empiricism, or the natural laws of mathematics, physics, and chemistry. But all predictions, one way or another, are based on observations. Whether you’re a fortuneteller or a mathematical modeler of hurricanes, you’re using observations one way or another. Well, the philosophy of forecasts goes back many years and Gottfried Leibniz, famous for Leibniz’s rule in mathematics, if you know that. I think we all learned that in our calculus courses. 1646 to 1716. A very interesting quote. “Everything proceeds mathematically. If someone could have sufficient insight into the inner parts of things, and in addition had remembrance and intelligence enough to consider all of the circumstances and take them into account, he would be a prophet and see the future in the present as in a mirror.” So read that carefully.
You have to have insight, remembrance, intelligence, and to consider everything. This is foreseeing models in a way, very complex systems. If you could understand everything, you could predict everything. And even more direct, the Marquis de Laplace. You know about de Laplacians, right, Laplace in mathematics. He was a mathematician. He dreamed of an intelligent being, an intellect, which was later dubbed, I guess by his colleagues, “Laplace’s Demon,” who knew the positions. He dreamed of an intelligent being who knew the positions and velocities of every single atom in the universe. And using Newton’s equations of motion, he could predict the motion of each one of these atoms, all the molecules that the atoms are part of.
They didn’t know about smaller, subatomic atoms at that time, but predict the future of the entire universe. And this long quote at the end is actually very prescient in terms of the theory behind developing numerical weather prediction models. We may regard the present state of the universe as the effect of its past and the cause of its future, an intellect, which at any given moment knew all the forces that animate nature and the mutual positions of the beings that compose it. If this intellect, think supercomputer, were vast enough to submit the data to analysis, could condense into a single formula to move one of the greatest bodies of the universe and that of the lightest atom, for such an intellect, nothing could be uncertain, and the future just like the past would be present before its eyes. The condition of every one of us in the room, every molecule, every wave out there, and all around the world, including the molecules in life itself, if you knew exactly where they were today, according to Laplace, you could predict everything in the future, how humans would behave, when they would die, how many children they would have, how many children the children would have, and so on and so on. A perfectly deterministic system if you knew where everything was and you knew all of the laws that we follow. That was Laplace’s view. And then Niels Bohr, the famous physicist, had a much simpler statement which sounds to me like Yogi Berra, more like Yogi Berra than Niels Bohr. “Prediction is difficult, especially the future.” True, I think we can all agree with that even though we may question Laplace’s Demon a little bit.
Well, Bjerknes, Vilhelm Bjerknes, getting into our field in 1904, the father of the Norwegian school of weather prediction, said the following. “If it is true, as any scientist believes, that subsequent states of the atmosphere develop from preceding ones according to physical laws, one will agree that the necessary and sufficient conditions for a rational solution of the problem of meteorological prediction are the following. Number one, one has to know with sufficient accuracy the state of the atmosphere at a given time.” Those are the observations, and, “One has to know with sufficient accuracy the laws according to which one state of the atmosphere develops from another.” That’s the mathematics and physics of how motion reacts to forces at a given time. And this is definitely the basis for numerical weather prediction. Well, then some 50 years later, along comes brilliant mathematician, actually a meteorologist, who became brilliant in the field of mathematics, one of the few ones that ever did this, Ed Lorenz from MIT, got into chaos theory and is alleged to have said, at least interpreted to have said, “Does the flap of a butterfly’s wing in Brazil set off a tornado in Texas?” This is now in popular mythology, in popular speeches, is the butterfly effect, and it’s the idea that you can never measure everything to a sufficient accuracy to make a good prediction, a perfect prediction. There’s always gonna be a butterfly somewhere that you don’t know, you can’t follow, and the butterfly flaps its wings and that sets off a cascade of events that lead to something as severe as a tornado in Texas or a hurricane in New Jersey. In the ’70s, Greg was talking about why I was developing numerical models and he had the so-called Mesoscale, and a lot of the larger scale dynamists said, “that you’re wasting your time because the smaller scales “of motion are never gonna be predictable, and why are you trying to do Mesoscale models?” So I was trying to think of a rebuttal to this and I came up with the idea that in many synoptic situations large scale situations, the small scales are forced by the larger scales. So if you know the large-scale waves, they produce fronts in more or less the right place, smaller scale events. They produce areas favorable for convection and so forth, so that if you know the large scale initial conditions and you can predict them, they will lead to small-scale phenomena, create small-scale phenomena, even before the small- scale phenomena exist.
And so you actually see that today. People are forecasting tornado outbreaks three or four days before tornadoes actually occur, even start to occur, because the large scale has predicted well and it predicts the environment of tornadoes. So, that was my argument for the fact that there was predictability in the smaller scales of motion, which according to predictability theories should be less predictable than for the very large scales. Anyway, if we look at some real data in this case. These are forecast accuracies of the European Centre for Medium-Range Weather Forecasting, ECMWF. Since 1981, has had the best global prediction model in the world. And the United States has tried desperately to catch up to this model, but has always lagged behind it by about a half a day’s worth of forecast. What this shows is the– You don’t need to understand what the skill scores are, but 100 at the top would be a perfect forecast, and 30 would be like a correlation coefficient of 30, wouldn’t be much value, but still some value over guessing. And the colors are different links to the forecast.
So the blue envelope is I guess day three forecast. So the day three forecast tend to be very accurate and they’ve been increasing in accuracy with time going from about 87% in the Northern Hemisphere in 1981, to nearly 96% in recent years. And they’ve leveled off. They aren’t getting much better, because apparently the 3-day forecast is close to as good as it’s ever gonna get. The lower part of that green envelope at the top is the Southern Hemisphere forecast. And you can see that it was much worse in 1981 than the Northern Hemisphere. And why is that? It’s because the Southern Hemisphere doesn’t have as much data. There are a lot more oceans and they don’t have as many balloons and so forth. But that gap is closed, until today it’s almost nonexistent and that’s because of satellites.
Satellites are global. They measure globally, and so the Southern Hemisphere gets just as good observations as the Northern Hemisphere now. And this is a dramatic testament to the power of global satellites of which Wisconsin, of course, is the leader in the world in satellite meteorology. The red curves are like five-day forecasts and the green curves are seven days or whatever. It doesn’t matter, but the forecasts are getting better at all-time scales. And the gap between the Northern Hemisphere at the top of each of the bands and the Southern Hemisphere is diminishing because of global observations. Absolute truth, positive truth of the impact of global models and satellite observations. So another one of the reasons I’m bringing up the resolution of these global models one at a time roughly at the same time scale as the bottom, so in 1981 the European Centre model had a horizontal spacing between data points of about 200 kilometers, 100 some miles. And what you’re seeing here is the resolution getting finer and finer, the pixel size getting smaller and smaller.
The model is resolving finer and finer scales. And that’s the picture of a hurricane. When it gets down to 16 kilometers and the last one is 10 kilometers, you can actually see Hurricane Katrina. But that’s what Hurricane Katrina looks like at 250 kilometers on the far left. It’s just a blur, a smudge. So you can’t even resolve hurricanes back in 1981 with these models, but currently you can, and that’s a testament to the value of computer power and good models in addition to the good observations. So the predictions are getting better all the time. The next slide shows a different way of judging how good models are. This goes back to 2008 technology of geostationary satellites.
It’s the Meteosat observations. And if I didn’t have these things labeled, even in 2008, you have trouble telling which is the model and which is the satellite, if you didn’t have these labeled, right? And you could probably tell if you stared at it long enough, if you were an expert, if you were either an expert in the models or in the geostationary satellite imagery, but just looking at it, the casual person is gonna say that model on the right is damn good, even without looking at numbers. And so you know the model is doing something right. And we were looking at one of the tornado models this morning or this afternoon. In the tornado model, the clouds were so accurate, you just know that they’re right, even without a lot of numbers. But this is actually one way of verifying models is to look at the pattern recognition. Humans are very good at seeing whether something looks good or not, whether it’s right or not, and you can see it there. And that was quite a few years ago. The models in the geostationary satellite like GOES are, what do you call them now, GOES-16? (mumbled response) Yeah, is a much better resolution on the satellites and much better resolution on the models.
So they still look very good together. But numbers are important. Here’s a record of official hurricane track errors over time from 1970, before models and before satellites out to 2016, the latest data I had from the National Hurricane Center. And the track errors are in nautical miles, which are very close to miles, from zero to 700. In this case, a low number is good because the track error, the error, the position error of the storm is smaller. And so you can see that the different forecasts, the red curve is 24 hours, the green is 48 hours and so on up to 120 hours, the dark blue at the top. With some year-to-year variation, all of these official forecasts are getting better. And they’re starting to maybe converge. Of course, you can’t get any better than zero, so at least the one-day, the two-day, and the three-day forecasts are getting pretty darn good to less than a 50-mile error in position of the storm.
So anecdotally the forecasts are getting better, like Hurricane Sandy. Statistically they’re getting better. We know why, it’s computer, it’s models, it’s satellite observations of all kinds. It’s better physics, it’s scientists working on this. This is not an accident. It’s not because of political philosophy or the people are better or anything like that. It’s pure science, physics, measurements, education. This is all something that we did, we as a community, as a university community, as government centers in Europe and the United States, we did this. This is not forgone, this is not an accident.
It’s the results of mathematicians and physicists and chemists and computer scientists and educated people and supportive graduate students and government grants doing all of this. And it’s saving thousands of lives, maybe hundreds of thousands of lives, just in this one little area, this little tiny area of weather prediction, it’s science and education. It’s not philosophy, it’s not praying to God. It’s doing something about it. It’s helping God by doing something for ourselves. And yet you have people that want to cut funding in these areas. The total NESDIS budget is about $2.1 billion a year, the satellite budget in the United States. $2.1 billion, it sounds like a lot, right? We’ve had 15 $1 billion disasters already in nine months of this year. And they, they want to cut it.
I’m trying to design the satellite system for 2030 and beyond, when I’ll be dead. I still think it’s important even though I’ll be dead. I have children, I probably won’t have grandchildren, but many of you have grandchildren. They’re gonna have children. And we need to be preparing for the science and the forecasts of 2030 and beyond. That’s what I’m trying to do. Let’s get back to what might be possible. Let’s get back to what some fun stuff is. All right, well this is an interesting thing that’s actually fairly old technology in the modeling area and visualization compared to some of the things you can do now.
But what it is, is a five-day forecast using a massive model, a very high resolution advanced model of Cyclone Nargis which is a major storm that developed in the Indian Ocean. And this shows the five-day forecast in this model of this genesis of this storm. It’s kind of an interesting, beautiful depiction but these are basically the wind flow at different levels. The greenish colors are low level flow, and the reddish colors are the upper level jets, and so you see a kinda low level flow. You’re looking at the Indian Ocean there. And you can see with time this vortex develops in the Indian Ocean. And there you can see it. That’s Cyclone Nargis in 2008. You can see this developing with no hint of anything of that scale in the initial conditions.
The large scale just did it. It was predictability of that tropical cyclone five days in advance by this global model in the right place and pretty much at the right time. Not exactly in the right place or exactly at the right time. And this is becoming or could become a routine. You saw this in Hurricane Sandy which is a real data case. So there’s the cyclone well developed. You can see the low-level inflow and the outflow, global model and initialized with real data. So again, we know what we’re doing. Okay, here’s a climate model for, I say quote “September 2000” which might be September 2500, 50 years from now, for an entire month.
And again, does this pass the reality test? Do you see hurricanes forming in the Atlantic and moving toward Florida or toward New Orleans? Does this look realistic? Well, look at that. That looks exactly like Hurricane Katrina. There’s more forming in the Atlantic. These large-scale models, with the righty physics and right ocean interactions, can produce hurricanes in the right place and time ontologically at least at the right seasons. Okay, so I am gonna start wrapping this up. Anyway, the summary is getting away from Laplace’s abstraction and being able to predict everything all the time at all scales and every human’s behavior and all their children’s behavior and all that. There is evidence that you can have greatly improved forecasts of such severe weather as tropical cyclones. I hope you remember the prologue, but these are really high impact events, days in advance. And then the boring line but you’ve got to keep pounding this home to the politicians that this is not by accident.
We need high resolution models, probably at four kilometers or better. We need improved physics, it means understanding. We need more PhD students working on these problems. And we need interactive ocean-atmosphere models. We need improved and initial conditions in the atmosphere temperature, water vapor, and winds-satellite observations are absolutely essential here. We need better data assimilation techniques. That’s ways of using these strange forms of data from the satellites and we need faster computers. So again this is one slice and one aspect of society but we know how to do it, and we just don’t have the will to do it, it seems sometimes. So back to the answer, the big picture.
Who wins, the butterfly or the demon, Laplace’s Demon? Well, there is a different between what is theoretically possible, that’s what’s called predictability, and what can ever actually be done, and that’s actually predictions. The demon may be theoretically possible, and that’s the question I think for philosophers. Not for us, because we’ll never be there in a practical point of view. But the butterflies are ultimately going to win. And I see there’s no reason not to help the demon a little, in such beneficial activities as weather prediction. And that’s the end of my talk. Thank you very much. I’d be happy to take any questions or outrageous statements or challenges or denial or whatever alternative points of view. Thank you.
Search University Place Episodes
Related Stories from PBS Wisconsin's Blog

Donate to sign up. Activate and sign in to Passport. It's that easy to help PBS Wisconsin serve your community through media that educates, inspires, and entertains.
Make your membership gift today
Only for new users: Activate Passport using your code or email address
Already a member?
Look up my account
Need some help? Go to FAQ or visit PBS Passport Help
Need help accessing PBS Wisconsin anywhere?

Online Access | Platform & Device Access | Cable or Satellite Access | Over-The-Air Access
Visit Access Guide
Need help accessing PBS Wisconsin anywhere?

Visit Our
Live TV Access Guide
Online AccessPlatform & Device Access
Cable or Satellite Access
Over-The-Air Access
Visit Access Guide
 Passport








Follow Us