The Same River Twice: Getting Voter Poll Questions Right
In 1948, four national polling firms infamously predicted that Thomas Dewey would win the presidential election by a comfortable 5 to 15 percentage points rather than the 4.4 percentage point victory won by President Harry Truman. This error brought the young polling industry to its knees.
November 11, 2016
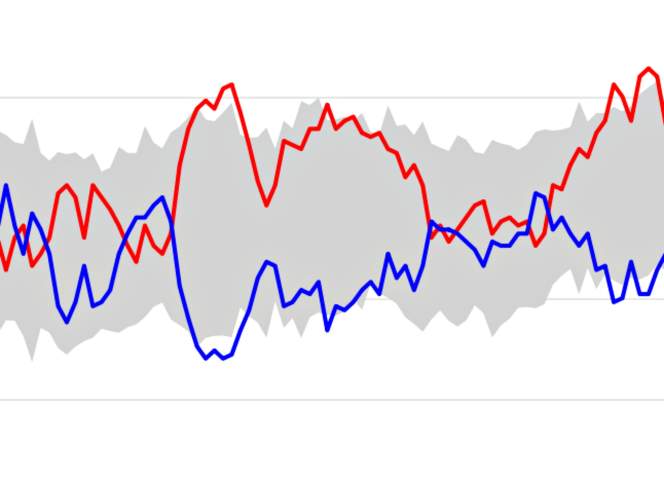
USC Dornsife/LA Times 2016 presidential poll chart

In 1948, four national polling firms infamously predicted that Thomas Dewey would win the presidential election by a comfortable 5 to 15 percentage points rather than the 4.4 percentage point victory won by President Harry Truman. This error brought the young polling industry to its knees. Nearly 70 years later, it offers a good starting point for understanding how polling can miss its mark.
Polling is both an art and a science that must constantly evolve to reflect the changing times and the most recent social science research. In the weeks following the 1948 election, George Gallup made the rounds to visit 30 newspapers that canceled his polling service. The Roper Poll founder, Elmo Roper, addressed his poll’s failings by publishing a column with the title “We were wrong. We couldn’t have been more wrong. We’re going to find out why.” Contemporary polling organizations are asking the same questions after missing the mark in the 2016 presidential election won by Donald Trump over Hilary Clinton.
The method by which individuals are interviewed for polls can affect the outcome.
National polls were conducted face to face for the 1948 election. The expense and difficulty of achieving a representative sample of the population with this method likely meant that groups of voters in hard to reach areas or difficult to identify populations were underrepresented. Although mail surveys could have been a possible solution to this problem, the many weeks needed for them to be mailed, completed, returned and tallied made this approach impractical in a rapidly changing election season.
Efficiently reaching a sufficient number of respondents was largely addressed by automated random digit dialing and extensive telephone sampling pioneered in the 1960s and 1970s when more than 90 percent of households had landline telephones. Today there are more telephones than at any other point in American history, but only about half of U.S. households contain a landline — the remainder rely on cellular telephones.
Unlike landline telephones, regulations prevent automated random dialing for cell phones. Instead polling calls to cell phones must be dialed manually, which is much more expensive and difficult. As a result, not all polls include cellular telephones. Furthermore, since people at the lowest income levels are far more likely to use cell phones only, these group can be chronically underrepresented in poll results. This shift has vexed polling organizations for the better part of the last decade.
Some people might think of online polling as a workable solution to efficient, timely and accurate polling, but obstacles exist with this method, too. The United States has approximately 239 million Internet users and about 324 million people. Although gaps in internet access are narrowing, rural areas often lack the broadband infrastructure necessary for accurate representation. Older citizens use computers and the internet at below average rates, and people from lower income brackets may find it difficult to afford the equipment and online access that many take for granted. As a result, more rural, poorer and older populations are underrepresented, sometimes vastly so, in online panels and polls.
The precise wording of poll questions and measures used can affect results.
To be fair, not all polls got it wrong in 2016. A post-election report on 2016 U.S. election polls by The Telegraph pointed out that 10 of the 93 polls published between Sept. 8 and Nov. 8 on RealClearPolitics predicted Donald Trump would win the election. One was from Fox News and the remaining nine were published by the University of Southern California Dornsife/Los Angeles Times Daybreak poll. Although the USC Dornsife/LA Times poll was often cited as an outlier by political blogs and news reports, it seems to have gotten it right in the crucial weeks leading up to the election.
Most polls used simple measures and tried-and-true question wording to determine if a respondent would vote for a particular candidate. While this method might have worked well in the past, it appears the time has come to improve and update questions and measures. In contrast to the majority of polls, the USC/LA Times Daybreak poll asked participants to rate the likelihood that they would vote for a candidate on a scale of 0 to 100 and to rate their likelihood of voting on the same scale.
Using a 0 to 100 point scale accomplished two things. First, it allowed respondents to express a degree of ambiguity toward a particular candidate and the act of voting itself. Second, it also allowed the USC Dornsife/LA Times pollsters to calculate a ratio of an individual’s likelihood of voting for a particular candidate to her likelihood of voting at all in the presidential election. In this system, a respondent who rated her likelihood of voting for Candidate X at 100, but her likelihood of voting at 25 would receive a different score than another respondent who rated his likelihood of voting for Candidate X at 80, but his likelihood of voting at 100.
The poll’s rationale for this approach was simple: A person’s thinking about the election might be altered by the act of answering a question prompting her to choose, especially if she is still weighing her options. These scale-based measures appear to circumvent that problem and produce a more solid result, although a conscientious social scientist would note that further study needs to verify this works in all conditions before advocating wider adoption of this new method. Still, the USC Dornsife/LA Times Daybreak poll correctly predicted the results of the election, and also identified the re-emergence and participation of conservative white voters who sat out the 2012 election, a group who voted for President-elect Trump in large numbers.
That tradition of transparency, honesty and accountability is the hallmark of a reputable polling organization. Modern polling organizations are likely asking some of the same questions addressed by George Gallup and Elmo Roper in the weeks after the 1948 election. Today’s pollsters should take the charge from the industry founders and share some of those answers with us, their public, in the weeks and months to come.
Kristin Runge is a communication researcher and community development specialist with the University of Wisconsin-Extension Center for Community and Economic Development.
 Passport





Follow Us