Wisconsin's Spring, Summer And Fall COVID-19 Surges
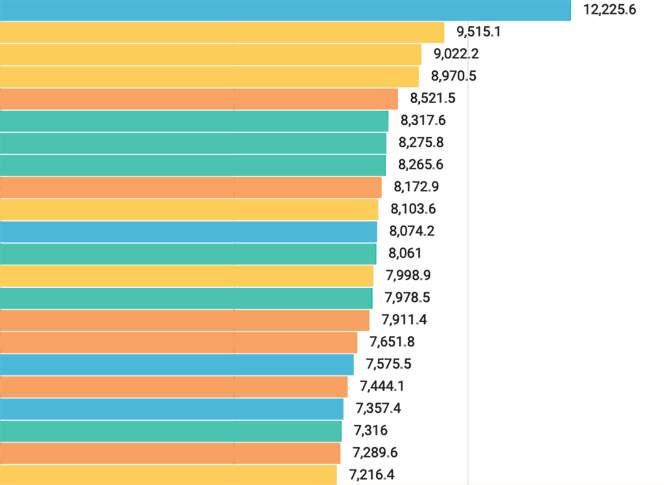
To better understand the shifting impact of the COVID-19 pandemic on Wisconsin over time, a series of data visualizations depicts the number of confirmed cases reported in each county from early March 2020, when the coronavirus started spreading in the state, to the end of November.
By Will Cushman, Kristian Knutsen
December 4, 2020

COVID-19 Per Capita Wisconsin Counties Rank Screenshot

The Wisconsin Department of Health Services issues data on a daily basis that list the number of new confirmed COVID-19 cases reported to the state by local health departments, as well as numbers of deaths and coronavirus tests conducted. Over time, these daily updates can reflect how the pandemic’s intensity and geography is shifting in the state.
Click or swipe to the following pages to view how the intensity of COVID-19 has changed across Wisconsin counties, by population size, rural-urban status, median age, hospital region and whether or not there is a state or federal prison present.
 Passport


Follow Us