A Season Of Hunger For Many Wisconsin Kids
For many school children, the summer months mean a lack of adequate food, including a well-balanced school lunch on a daily basis.
July 19, 2019
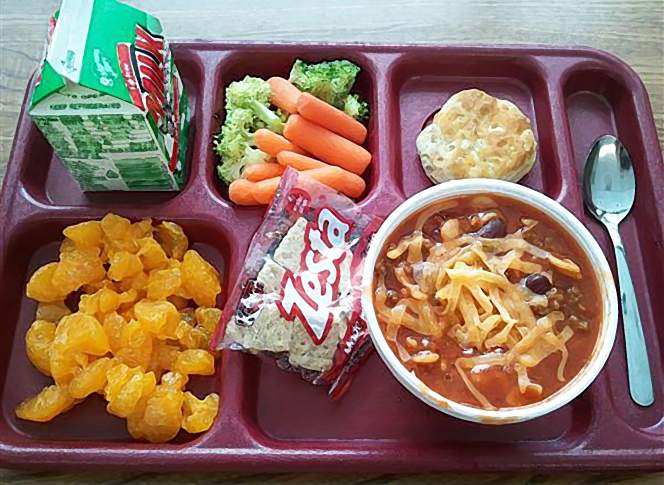
School lunch with chili illustration

Summer is often a time of care-free, sun-drenched days with long nights free from homework and sports practice. However, for many school children, the summer months mean a lack of adequate food, including a well-balanced school lunch on a daily basis. Students who are eligible for the National School Lunch Program, depend on this program throughout the school year to provide lunches at a reduced cost or no cost.
Over a half million Wisconsin children relied on free or reduced lunch at participating schools during the 2017-18 school year, which covered 82 million total meals.
Implemented in 1946, this federally assisted meal program administered by the U.S. Department of Agriculture provides low-cost and free lunches to millions of children each year. As detailed by the School Nutrition Association, in 2017-18 the federal program reached 100,000 schools and educational institutions across the nation, delivering lunches to over 30 million children daily nationwide.
Children qualify for free or reduced price meals at school based on poverty guidelines set each year. These guidelines consider household income and family size and are used for administrative purposes to determine eligibility for federal assistance programs.
The U.S. Department of Health and Human Services updates poverty guidelines each year to determine student eligibility for the school lunch program. Children in households with an income at or below 135% of the poverty line are eligible to receive free lunches, while those between 130-185% are eligible for reduced priced meals.
Statistically, poverty can be measured in many different ways. The official poverty rates from the U.S. Census American Community Survey are published annually. In 2017, more children than adults in Wisconsin lived in poverty — 11.3% of the state’s total population was below the poverty level, while 14.5% of children lived below that mark.
The maps below highlight the percentage of students by school district in Wisconsin who were approved for the free and reduced lunch program and the rate of child poverty.
A comparable pattern between students who are eligible for the school lunch program and the official child poverty rates by school district can be observed. At a more specific geographic level, school districts in cities and in the northern part of the state that participate in the program have higher rates of child poverty as compared to many of the school districts in the eastern and south-central portion of the state.
Eligibility and participation in the National School Lunch Program can be a proxy for measuring child poverty. Each October, school districts submit a reimbursement claim to the Wisconsin Department of Public Instruction, which administers the program around the state. The chart below shows the percentage of Wisconsin public school students approved to participate in free and reduced lunch from the turn of the century to the 2018-19 school year.
The number of eligible students increased on a steady basis until the 2014-15 school year, followed by a consistent number of students receiving free and reduced lunches over the following five years. Eligibility rates have hovered around 44% from the 2015-16 to 2018-19 school years.
The geography of free and reduced lunches
Public school districts can be defined as either urban, suburban, town or rural. By these definitions, urban districts in Wisconsin enroll 31% of the state’s total student population, while suburban districts comprise 28%. The remaining two-fifths of the state’s student population is almost equally distributed between town districts at 22% and rural districts at 19%.
The chart below compares the percent of students eligible for the National School Lunch Program and the child poverty rates by these four location categories for the 2018-19 school year.
The location category with the most students eligible for free and reduced lunch are urban districts, covering 57% of their enrolled population. Concurrently, 42% of the students in rural districts are eligible for free and reduced lunch, followed by 40% of students in town districts. Only 24% of students in suburban districts are eligible.
A similar trend of children living below the poverty level can be observed by location category. Child poverty is the highest in urban districts at almost 20% overall, with almost 40% of students in Milwaukee Public Schools living below the poverty level.
The location category with the second highest percentage of children living in poverty are those in rural areas, at 15%. However, the greatest percentage of child poverty is districts that are classified as rural, with Menominee and Lac du Flambeau (an elementary school district that is part of the Lakeland Union High School district) at almost 54%, Necedah at 46% and Marion at 42%. Child poverty in town districts is at 13%, while only 8% of students in suburban districts live below the poverty level.
Many Wisconsin students depend on the National School Lunch Program, particularly in urban and rural parts of the state. As students savor their summer vacation, almost two in five of these children do not have access to the nourishment provided by this far-reaching program.
Sarah Kemp is a researcher with the school enrollment projections program at the University of Wisconsin Applied Population Laboratory and the UW-Madison Department of Community and Environmental Sociology, and studies school demography with a focus on rural schools. She is also a member of the Lakeland Union High School Board of Education.
 Passport





Follow Us