Marisa Wojcik:
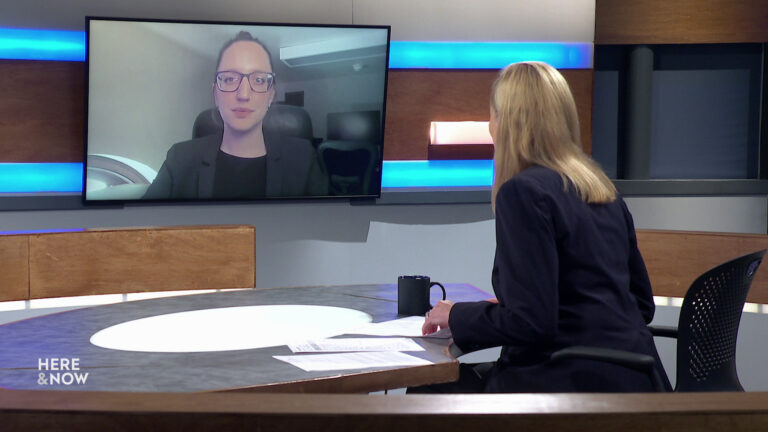
Welcome to Noon Wednesday. I’m Marisa Wojcik, a multimedia journalist with Here & Now on Wisconsin Public television. So every year, the UW Population Health Institute looks at a myriad of factors that contribute to health, county by county and state by state. And the county rankings reports find that your quality of health is largely linked to where you live and this year in particular connects access to quality, affordable housing to a determinant of health. So joining us is the Population Health Institute’s Director, Dr. Sheri Johnson, thanks so much for being here.
Dr. Sheri Johnson:
Thank you for having me.
Marisa Wojcik:
I want to start with looking at this year’s data. Did you choose to highlight housing as determinant or did it really stand out when you were looking at the data in a particular way?
Dr. Sheri Johnson:
That’s a great question, so we did choose to focus on housing. It’s one of the factors that we know is linked to both length of life and quality of life and we also know that there is a larger conversation going around regarding how housing and health are related and lots of sectors are getting involved in the conversation. So healthcare is jumping in to this conversation and actually moving toward action. So we thought it was timely to lift up the ways that housing affordability and security relate to our health.
Marisa Wojcik:
And did that seem true across the entire state or did that seem particularly true only in certain counties?
Dr. Sheri Johnson:
So as you said, we really want to lift up this notion that where you live matters for your health. So both the county that you live in, as well as the house that you live in have implications for your health. So place by place, county by county in Wisconsin, we see different length of life and quality of life, and then within counties, we also see that there are differences in terms of how long and how well people live, and we see those differences by race and ethnicity in particular. So it’s both where your house is located and how safe your house is, so things like exposure to toxins, things like adequate plumbing and electricity, all of those things.
Marisa Wojcik:
Lead exposure.
Dr. Sheri Johnson:
Lead exposure can have impacts on health.
Marisa Wojcik:
And you mentioned race and ethnicity and that’s another thing that you highlighted as potentially showing health outcomes, what were those groups and what did you find?
Dr. Sheri Johnson:
Right, so the range of housing costs burden. So one of the things we focused on this year is what we call severe housing costs burden and what that means is that you’re spending 50% or more of your income on housing costs alone. And so you can imagine, that if you’re spending 50% of your income on housing, it doesn’t leave much left over for healthy food or transportation to and from work or the opportunity to make contributions to your church or your other faith institutions. So this notion of spending more than 50% of your income on housing really speaks to the idea that it may diminish the opportunity for you to make investments or choices about all the other things that you need to be healthy. So within Wisconsin, we do see a range at the county level for severe housing costs burden, and we also see differences by race and ethnicity. So the average is about 13% of households in Wisconsin that are spending 50% or more of their income on housing, but the range is pretty wide, from about 10% all the way up to about 22%. And so then within racial groups, we also see a difference. So for African Americans who are most burdened by severe housings costs, about 28% of African Americans are spending 50% or more of their income, compared to about 11% of people who identify as white.
Marisa Wojcik:
And this is a common trend where if you look at the average of data, you can say, this is where Wisconsin ranks, but once you disaggregate the data and look at it through race and equity lens, then that changes. Is that going to be a factor in improving these health outcomes?
Dr. Sheri Johnson:
Well I think it speaks to how do we choose our action strategies? And how do we make sure that we don’t just address the overall average, but we really look at each group and understand how close or how far they are from achieving good health and then decide what are the appropriate investments. And all of that is really also in a historical and present context of the way that policies have either allowed certain groups of people to access the things that they need to be healthy, like safe housing, home ownership, or have really been obstacles for certain groups. So if you think about policies like redlining that allowed some groups of people to purchase homes and to build equity and to use that equity to pay for their young people’s post high school education, that’s sort of the ripple effect that we’ve seen that result in some of these differences by racial and ethnic group that we’re reporting even now in 2019.
Marisa Wojcik:
And so speaking of policy, as we speak the legislature, the Wisconsin state legislature is working on a biannual budget, 81 billion dollars, it’s a lot of money, does your organization advise or advocate for certain policies, especially when it comes to something as big as the budget, or do you just provide this data and say this is what we have, do what you will with it?
Dr. Sheri Johnson:
So there are two ways that we try to lift up solutions that work for the legislature and for Grassroots Leaders to consider. So one is through the county health rankings and roadmaps, we have something called what works for health, and we have a specific site, what Works for Health Wisconsin and this curates what the current evidence exists across this range of factors that we know impact health. And so policy makers, local community residents, tribal leaders, can take a look at this website and look at what has been shown to work and we rate things across a continuum, so scientifically supported means that there are more than one study that have shown that the outcomes that you’re seeking to achieve have been achieved, all the way down to this might be harmful, don’t do it. We know that decisions need to be made to fit the local context, so both the state context, and then at the county context, so we don’t prescribe to people what they should or shouldn’t do, but we offer up what the current evidence is and we offer up a set of what we call action resources that can help people start with the data and then move across a take action cycle to decide which policies and programs fit their context best. We also offer something called the evidence-based health policy program which is part of the population health institute, and that recently just held a capital briefing on housing and that seeks to bring experts from the university into conversation with community based experts and the legislature to say what do we know? And how does what do we know or what we don’t know, what are the gaps, impact the decisions that need to be made? So we recently had in 2018, a capital briefing on housing that people can access through our website to look at both what researchers and local practitioners are doing to advance housing as a lever for health.
Marisa Wojcik:
And what’s the reception that you get? Because in some of my coverage of the Joint Finance Committee, some debate between lawmakers from different areas, particularly someone representing Milwaukee, versus a more rural district, the debate comes down to arguing over geographic space, and whether or not that’s something for a state lawmaker to make appropriations for. Do you think that there’s a better place for kind of local bottom up initiatives to happen with some of these things or does it have to kind of come from the top and the bottom?
Dr. Sheri Johnson:
I think it’s both and so this curated list of policies and programs can inform local policy making, state policy making and what we’re really trying to do is advance the conversation across the whole range of stakeholders, for community residents who might be organizing to improve their local neighborhood, to elected officials that there is a body of evidence and they can also help us know what questions haven’t been asked and answered so that researchers at the university can then take those unanswered questions and use the best science to help answer them. So it’s really this bidirectional flow of information that we think is important.
Marisa Wojcik:
So in particular, Ozaukee County ranked the most healthy, and Menominee County ranked least healthy. What can we learn from that without exactly pointing fingers?
Dr. Sheri Johnson:
Right, and so the rankings are meant to sort of inform people about the ways that multiple factors can influence health and their meant to spur conversation and spur action. So if you’re ranked the lowest county, it’s not intended to be a pejorative, it’s intended for communities to then get to the table and dig into the data and figure out what’s going on and what they can do about it. And so what the data really shows is that social and economic conditions matter for health and so Menominee nation in particular has been highlighted in our culture of health cries because they really did dig into the data and say, you know, our high school graduation rate in our main high school is not what we like it to be, and they then took to action to implement trauma informed school policies to address historical trauma that had occurred and to improve the outcomes for the young people in their schools and they were recognized by the Robert Wood Johnson Foundation and the Culture of Health Prize, for showing tremendous progress toward high school graduation rates which are one of those drivers of long term health of a community. So even if you are a county that’s ranked in the lower group of counties, it doesn’t mean that you’re not doing amazing work to change that reality.
Marisa Wojcik:
And so they have seen some successes.
Dr. Sheri Johnson:
They absolutely have seen increases in the high school graduation rate and if you look on the Culture of Health Prize website, you can hear them tell their own story about the ways that they have addressed that through trauma informed school policies, as well as a host of other programs and policies for their community.
Marisa Wojcik:
As a scientist, do you worry that some of this data could be misused or manipulated for certain political reasoning one way or another, especially if some of the data maybe isn’t surprising to you, you know, how do you keep people’s interest and make sure that they’re taking appropriate action on it?
Dr. Sheri Johnson:
Right, so I like this quote. I don’t know who said it, but the data never speak for themselves. So it’s really important to help people cultivate these conversations about what is the data? What does it mean? Where did it come from? What’s missing from the story so that people can take the data and use it to improve health and equity? We certainly can’t control everyone’s narrative, but in our action learning guides that are available on the website, as well as a host of other tools, we try to support what’s sometimes called data fluency or data literacy to help people understand how to use the data for action. So year over year, it kind of seems like some of these data points remain consistent, maybe the needle moves slightly, but was there anything that did stand out to you? Specific examples of things that shifted that are maybe worth kind of looking at to understand why that shift was a little bit more dramatic than in other areas? So this is descriptive data. So we don’t have causal relationships to report through the county health rankings. It’s really a snapshot in time using publicly available data sources that help describe the current health of a community, but some of those social and economic factors really help people to understand the potential future health of a community. So when we invest in K through 12 education, we have lots of evidence to show that education is highly correlated and predictive of adult health status. So it’s those kinds of relationships between health factors, not just healthcare, but education, income, employment, access to clean air and clean water, that these reports really are intended to help shift the conversation so that health is understood as a set of broad factors, not just access to healthcare. Although, access to healthcare is extremely important. It’s one of many things that we know drive community health.
Marisa Wojcik:
And you look at the entire nation.
Dr. Sheri Johnson:
We do.
Marisa Wojcik:
What did Wisconsin look like compared to other states?
Dr. Sheri Johnson:
So we don’t do state to state comparison, so it’s the county health ranking. So we rank 3,000 plus counties across the country, but the comparisons are really within the states. So like you said, we look at the healthiest county in the state this year was Ozaukee and the least healthy was Menominee, but we don’t really take Ozaukee and compare it to Santa Monica, California.
Marisa Wojcik:
So who do you hope uses this data and what do you hope that they’re using it for? It’s sometimes… You have descriptions of kind of what some of the data means and you can contextualize it, we also provide some of a little bit more scientific results. So kind of, what do you envision people use it for?
Dr. Sheri Johnson:
Right, we hope that change makers across the spectrum use it to improve health and equity. So by change makers, we mean people at the local level living in neighborhoods who look around their neighborhood and say, “Too many of us are living in homes “that have lead-based paint, what can we do about it?” We want them to take the data and then discuss amongst themselves what the data tells them about the conditions that they have or need for health and then decide what to do about it. We also want that to happen with elected officials at all levels of government. We want that to happen across sectors, so the housing sector, the transportation sector, the K-12 education sector, the employment sector. All of them have a part to play in advancing health. So we want this to be a set of data and a set of tools that multiple sectors can utilize so that people live longer and healthier lives.
Marisa Wojcik:
And what are some of the evidence-informed strategies that you mentioned in your report, and that you just mentioned earlier, that people can kind of look at in terms of how it relates to your findings?
Dr. Sheri Johnson:
Right, so there’s a whole range of evidence-informed approaches. Things like community land trusts that have some evidence to multi component interventions to assess toxic exposures in the home. There are strategies related to housing subsidies and voucher programs. So it’s a range of different strategies. There’s no sort of one strategy is going to fix the problem and it really also depends on what the nature of the problem is at the local level. So any combination of those might be used to improve housing and subsequently to improve health.
Marisa Wojcik:
Where are you looking for the county health rankings report to go in the future? Are you going to be looking at new factors? Or are you kind of hoping to kind of continue the work that you’ve done this year?
Dr. Sheri Johnson:
We’re always thinking about what else we should be measuring and how those measures can help people at the local level make change. And so we have something called a scientific advisory group that helps us to think about what are the other important factors that drive health, what’s missing from our model and then importantly, we look for data again that has a lot of coverage across the majority of counties so that we can include most of the counties in the United States. We want the data to be available over time so that we can look at trends. We want it to be publicly available so that people can assess the strength and weakness of the data set itself. So there are a range of decision points that we use to decide when to add a measure or change a measure and that comes from lots of sources, but the scientific advisory group and our A plus staff lead that thinking.
Marisa Wojcik:
Sounds a little overwhelming. That’s a lot of counties to cover.
Dr. Sheri Johnson:
It is, it’s a big project and we really have been encouraged by the way that the conversation has changed. This is going to be our 10th release in 2020 and we’re seeing that we’re getting more sectors involved in the conversation. We’re seeing that there is a pretty broad understanding amongst governmental local public health leaders that health is more than health care and that their leadership at the local level includes connecting with other sectors to engage them in this conversation about creating conditions where everybody can be healthy, whether it’s through things like in Appleton. The health officer there has worked with the mayor and other constituents to have a Health In All policies ordinance so that when you’re making decisions about parks or you’re making decisions about transportation, or you’re making decisions about public works, that you’re thinking about how those decisions are going to impact length and quality of life. So there’s some really excellent examples in Wisconsin. In Algoma, they won the Culture of Health Prize as well and they’ve been working on something called Wolf Tech, I think is what it’s called, where it’s an entrepreneurial hub for your people and it’s a way that the business community and the education community have come together to say, how do we prepare our young people to have the jobs of the future? So there’s a lot of really innovative work that’s happening in our state.
Marisa Wojcik:
Well Sheri, that’s very interesting. Thank you so much for joining us.
Dr. Sheri Johnson:
Thanks for having me.
Marisa Wojcik:
For more from Here & Now on Wisconsin Public Television, you can visit wpt.org and our partners at WisContext have also written up an essay about the county health ranking. So visit that at WisContext.org and thank you so much for joining us on Noon Wednesday.
Search Episodes
News Stories from PBS Wisconsin

Donate to sign up. Activate and sign in to Passport. It's that easy to help PBS Wisconsin serve your community through media that educates, inspires, and entertains.
Make your membership gift today
Only for new users: Activate Passport using your code or email address
Already a member?
Look up my account
Need some help? Go to FAQ or visit PBS Passport Help
Need help accessing PBS Wisconsin anywhere?

Online Access | Platform & Device Access | Cable or Satellite Access | Over-The-Air Access
Visit Access Guide
Need help accessing PBS Wisconsin anywhere?

Visit Our
Live TV Access Guide
Online AccessPlatform & Device Access
Cable or Satellite Access
Over-The-Air Access
Visit Access Guide
 Passport






Follow Us